
Browse Items (20 total)
This map allows viewers to explore different countries' rankings from the Index of risk management. Both natural disaster risk and socioeconomic…
 Index for Risk Management
We looked specifically at the rankings of natural disaster risks as well as socioeconomic vulnerability per top and bottom-performing countries in…
 Position Paper (Provided by Professor Nillas)
This resource provided by our advisor Professor Nillas helped gave us background information and helped guide us in the creation of our project.
 Teachers' Formal Education by Country
This data table exhibits the percentages of eighth grade mathematics teachers per country that have completed a postgraduate degree.
 A Textual Analysis of the Singapore Ministry of Education Mission Page
A visualization of the frequencies of certain words that appear on the Singapore Ministry of Education Mission Page.
 A Textual Analysis of the Philippines Department of Education Mission Page
A visualization of the frequencies of certain words that appear on the Philippines Department of Education Mission Page.
 Expenditure Per Capita
This infographic is a scatterplot of TIMSS 2019 data and expenditure per capita. The line of best fit helps display the correlation between the two.
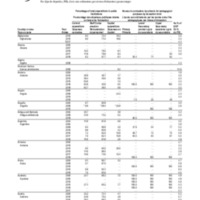 Public Expenditure on Education per Country
This database provides information regarding each country's public expenditures on education throughout the years. With this data, we were able to…
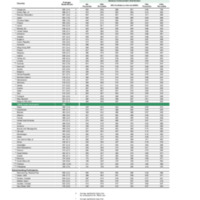 TIMSS Average Science Achievement and Scale Score Distributions
This database provides statistics of academic performances in 4th-grade science per country. We used it as an academic reflection for the countries we…
 Expenditure Data Per Capita
This database provides information on the expenditures and GDPs per capita of each country. Using this database, we were able to draw correlations…